How to run an A/B test you can trust
Most ideas don’t move the number you care about. An A/B test is how you find the few that do, without fooling yourself. Here is what makes a test trustworthy, why small apps need patience, and what Nalya does with yours.
You have a hunch. A new paywall headline, a shorter onboarding, a rating prompt that shows up a little earlier. It feels obviously better. The uncomfortable fact from decades of online experiments is that most hunches are wrong: at large tech companies, about two-thirds of the ideas that get built and tested fail to improve the metric they were meant to improve, and in well-tuned products the failure rate reaches 80 to 90%.1 An A/B test is how you tell the rare real win from the rest.
The anatomy of a fair test
A trustworthy A/B test has four parts, and each one is there to stop you from fooling yourself.
- A hypothesis
One sentence you can be wrong about: “A benefit-led headline will get more paywall viewers to buy than today’s price-led one.”
- Variants
A control (what users see today) and one or more test versions. Change one thing, so a result tells you what caused it.
- One primary metric
Pick the number that decides the test before it starts, such as purchase_completed per user. Watch ten metrics and one of them will move by chance.
- Randomization
Users are assigned to groups by chance, not by you. That is what makes the groups comparable, so any difference between them comes from the change.
In a mobile app, the split usually lives in a feature flag. Both versions ship in the same build, and the flag decides per user which one they see. Starting, pausing or ending a test changes the flag, not the binary, so none of it waits on App Store or Google Play review.
How many users you need, and why small apps wait
The smaller the effect you want to detect, the more users you need, and the relationship is steep. A widely used rule of thumb puts the users needed in each group at 16σ²/δ², where δ is the smallest change you care about and σ² is how much the metric varies.3 Because δ is squared, detecting an effect half as big takes four times as many users.4
Your paywall is seen by about 300 people a day, and 4% of them buy. You want to test a new headline, and a lift you would act on is +25%, from 4% to 5%. That is δ = 0.01, and σ² = 0.04 × 0.96 = 0.0384.
n = 16 × 0.0384 ÷ 0.01² = 6,144 users per variant
Two variants need 12,288 paywall viewers, which at 300 a day is about 41 days. If you wanted to catch a +10% lift instead (4% to 4.4%), the same formula asks for 38,400 per variant: 256 days.
The world’s largest experimenters usually read a result from one to two weeks of data, and it is common for each of their tests to reach over a million users.5 An indie app does not have that traffic, so the practical lessons are different:
- Test bold changes. A new paywall layout can move the number by 20% or more. A button color rarely will, and you would never be able to see it.
- Test where the traffic is. Onboarding and the first paywall see every new user. A settings screen deep in the app may never reach the sample size.
- Decide the size first. Work out how many users you need before you launch, and plan to wait for them.
- Run whole weeks. People use apps differently on weekends. Ending on a full week keeps one odd day from skewing the result.
Peeking: the most common way to fool yourself
Results move a lot in the first days, because a handful of purchases either way swing the percentages. If you check every day and stop the first time the test looks significant, you will often stop on noise. Evan Miller simulated exactly this: a change with no effect at all, tested at 5% significance after every new observation. It was declared a winner 26.1% of the time, more than five times the 5% the test claims.6
Looking is fine. Acting on an early look is the problem. Decide the sample size in advance, check in to make sure nothing is broken, and make the call when the test has run its course.
Reading a result: uplift and chance to win
Uplift is the relative change in the metric, test against control. If control converts 4.0% and test converts 5.0%, the uplift is (5.0 − 4.0) ÷ 4.0 = +25%. It tells you how big the effect looks, not whether it is real.
Chance to win answers the second question. PostHog, which runs the experiments Nalya manages, uses a Bayesian method: chance to win is the probability that the test variant is actually better than control, given the data so far. By default a result counts as significant when that probability is above 95% (or below 5%, meaning control is better), and only once each variant has at least 50 exposures.7
Back to the paywall example. Day 41 arrives with about 6,000 viewers in each group. Two ways it can end:
- Control
- 240 of 6,000 bought (4.0%)
- Test
- 300 of 6,000 bought (5.0%)
- Uplift
- +25%
- Chance to win
- about 99.6%
Above the 95% bar. Ship the new headline.
- Control
- 240 of 6,000 bought (4.0%)
- Test
- 246 of 6,000 bought (4.1%)
- Uplift
- +2.5%
- Chance to win
- about 61%
Close to a coin flip at full size. Keep today’s headline and stop.
Illustration. Chance to win here is approximated from the two purchase rates.8
When to stop a flat test
Most tests end like Ending B. That is not a failure: you learned that the change does not matter at the size you can measure, and you can stop spending traffic on it. Once a test reaches its planned size, a chance to win stuck in the middle is the answer. Keep the simpler version, usually the one you already have, and test something bolder.
Extending a flat test “just a bit longer” until it tips is peeking in reverse. If you truly need more precision, plan a new size and commit to it.
What Nalya does
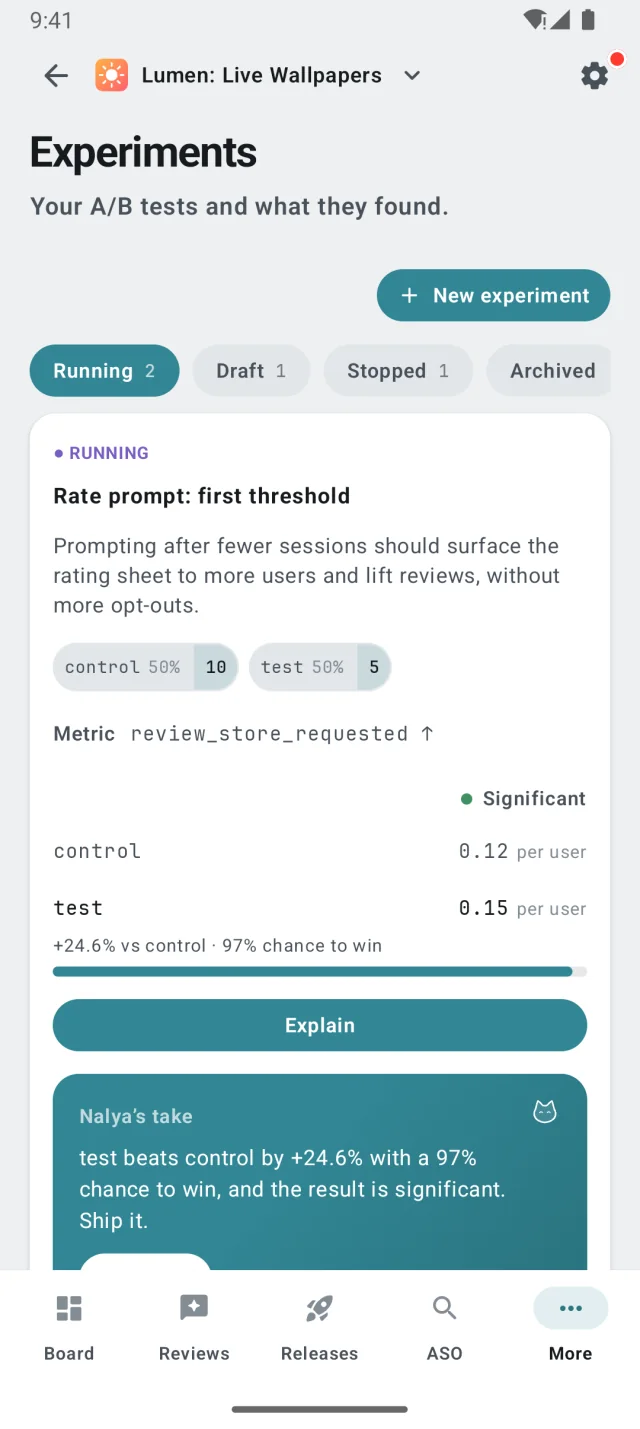
Nalya manages your experiments in your connected PostHog project, from the console or the Nalya app.10 PostHog does the assignment and the statistics; Nalya turns them into a decision and keeps the steps in one place.
- Create. Give the test a name, a flag key, a hypothesis, two to six variants with a split that adds up to 100, and one primary metric: an event, and whether it should go up or down. Nalya creates the draft in PostHog, which creates the linked feature flag.
- Run. Launch, pause, resume and stop from the same card. Each change is recorded in Nalya’s activity log.
- Read. Results come from PostHog’s latest computation: the metric per user for each variant, its uplift and its chance to win, with a Significant badge once PostHog calls it. When results are more than 6 hours old, Nalya asks PostHog to recompute them in the background.
- Per store. PostHog’s statistics cover every platform at once. If your app is on both the App Store and Google Play, the card can also show iOS users only or Android users only. Those per-store numbers are Nalya’s own estimate from $os-tagged events, and the card says so.
- Ship. Shipping the winner rewrites the flag so that variant serves 100% of the users it already targets, records the test as won, and archives it. Before anything changes, a sheet spells out what will happen.
On every test, the verdict says one of these things:
- A real winner
A variant leads and PostHog marks the result significant. Nalya’s take names it, with its uplift and chance to win, and says ship it.
- The current version holds
The data says no variant beats what you have. Nalya’s take says keep the current experience and stop the test.
- Not decided yet
The numbers stay on the card, refreshed as data comes in. A variant that leads without significance can be shipped early, with a clear warning that the call is yours, not the data’s.
- Explain
One tap turns the numbers into a short, plain-language read of what the test found so far.
When a test has a real winner, it also shows up on your Board, so you hear about it without opening Experiments.
Testing your store listing itself, such as screenshots or descriptions, is a separate feature that lives in ASO.
- Ron Kohavi, Diane Tang, Ya Xu, Lars G. Hemkens and John P. A. Ioannidis, “Online randomized controlled experiments at scale: lessons and extensions to medicine”, Trials 21, 150 (2020). About two-thirds of experiments show promising ideas failing to improve the metrics they were built for; in well-optimized areas such as search, 80 to 90%. ↩
- Kohavi et al., Trials (2020), above: “Any figure that looks interesting or different is usually wrong.” Kohavi, Tang and Xu cover the same ground at book length in Trustworthy Online Controlled Experiments (Cambridge University Press, 2020). ↩
- Evan Miller, “How Not To Run an A/B Test”, gives n = 16σ²/δ² as a rule of thumb. The 16 is about 2 × (1.96 + 0.84)², so n is the size of each group for a two-sided 5% test with 80% power. For a conversion rate, σ² = p(1 − p). ↩
- Kohavi et al., Trials (2020), above: detecting an effect twice as small requires quadrupling the number of users. ↩
- Kohavi et al., Trials (2020), above: the final treatment effect is usually based on 1 to 2 weeks of data, at companies where each experiment often reaches over a million users. ↩
- Evan Miller, “How Not To Run an A/B Test,” above. His simulation: a change with no effect, a 5% significance test run after every observation, stopping at the first significant result or at 150 observations. ↩
- PostHog, “Bayesian statistics” (Experiments docs): chance to win is “the probability that the treatment variant is actually better than control.” A result is significant when it is above the confidence level (95% by default; 90% and 99% are options) or below its complement, with at least 50 exposures per variant by default. ↩
- The example’s chance to win uses a normal approximation of the difference in purchase rates. A Bayesian method with an uninformative prior gives a value close to it at these sample sizes. ↩
- Aleksander Fabijan et al., Microsoft Experimentation Platform, “Diagnosing Sample Ratio Mismatch in A/B Testing” (Microsoft Research, 2020): about 6% of Microsoft’s A/B tests have a sample ratio mismatch. ↩
- Experiments need a connected PostHog project. On the published plans, Experiments is part of Scale. ↩